Tag Archives: Monetization Review

WordAds Revenue Q2, 2026

Previous Article (WordAds Revenue for Q1 2026)

Last Updated July 7th, 2026.

Recorded early in May 2026

Updated Second Quarter Guidance

I was getting ready to post a Q3 report when i realized that i had posted the Q1 and Q2 reports too early, before all of the quarterly data became available.

So, instead of making a Q3 at this time, I will be updating this Q2 report. The next report for Q3 should be posted in October and will include July, August, and September ad revenues.

Ad Revenue by Month

April

The site received 9,669 views from 5,412 visitors averaging 1.79 views per visitor.

I wrote 31 posts in April.

Average CPMEarningsAds Served
$0.26$5.3820,435

In April, I update a whole bunch of posts and even hit the republish button on them. That would account for the high number of posts listed for April. I don’t normally write that much unless I am inspired.

I did play some mobile games, but didn’t see much traction on the guides I wrote for them. I did some housekeeping in the wikis and cleaned up the Dragon Traveler and Cheerleaders GO collections.

Dragon Traveler has a big audience, so adding details to the wiki really improved my site traffic.

Unfortunately, there is now an English language mirror wiki from the official Dragon Soul Traveler (龍魂旅人) wiki that has received official recognition. I can’t really compete with a dedicated site with editors and authors.

If you do a Google Search for “Dragon Traveler wiki,” this site in in position 4, while the new dtwiki site is number 1.

May
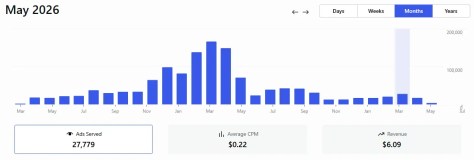
The site received 10,058 views from 4,714 visitors averaging 2.13 views per visitor.

I wrote 15 posts in May.

Average CPMEarningsAds Served
$0.22$6.0927,779

In May, I tried to ramp up my posting but didn’t find much success. I have several posts, from this period, with 0 page views. I continue to add new content to my running work, the “eBay Style Code Catalog.”

It’s only got 2 views, and I suspect they were from me, when I checked to see if the post was visible on Google Search.

June

The site received 7,040 views from 3,826 visitors averaging 1.84 views per visitor.

I wrote 6 posts in June.

Average CPMEarningsAds Served
$0.30$5.0617,151

June was a slim month mostly because I was busy with my eBay stores and my travel blog Kasanje Travel’s. I enjoy street photography and local trips by car.

So, I didn’t do any game offers during this month. That meant I had no new content for this site.

Other Income Streams

Affiliates

I signed up for a couple of Affiliate programs however I have not had any earning from those platforms yet.

I have ads for the affiliates on most site pages in the sidebar.

eBay

I also include links to my four eBay channels: lafemme1st, fatwalletrefugee (FWR), golfforless, and kingcastlehomeimprovement. Sales are sporadic in the golf and hardware stores, this is primarily limited by my ability to acquire and stock quality goods in these area.

The majority of my eBay earnings come from the FWR and La Femme 1st stores. I sell men and women’s apparel primarily, although FWR does stock various knickknacks I’ve hopefully picked up.

eBooks

I briefly got into Amazon eBooks back in 2023 with the arrival of generative AI. I have since lost interest in that area and not been proactive in creating content.

The few items I have published do occasionally get viewed on Kindle Unlimited and I receive a few pennies now and then. It’s surprising since the AI tech back then was fairly rudimentary compared to the perfect images contemporary engines can create.

WordAds Third Quarter (2025) Results

Things have suddenly improved since my last report in July.

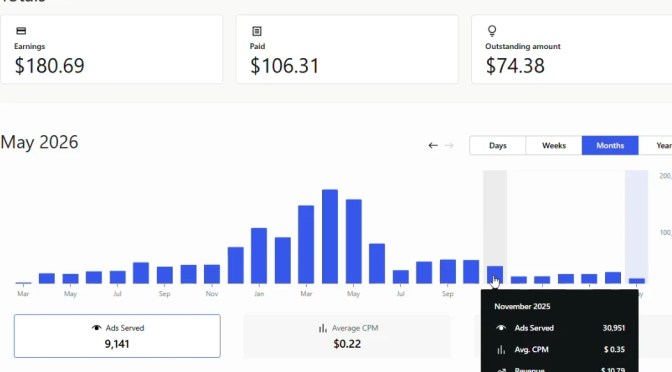
This morning, I received an email saying that my PayPal account had received a payment from Automattic for $106.31. I checked my Ads panel and found that it is the exact amount in my balance.

I had assumed the payouts were manual and needed to be requested. But this assumption was based on posts I have seen in the WordPress Forums. It seems the payments are automatic after reaching the necessary threshold of $100.


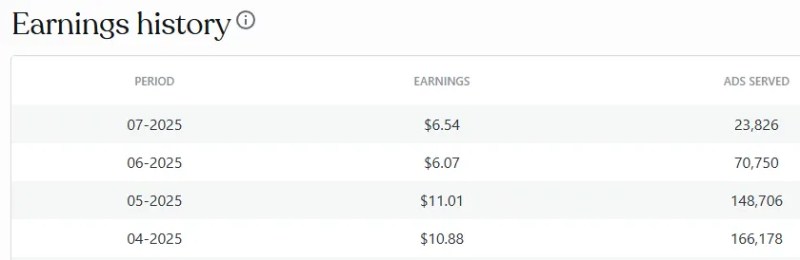
My previous post would have covered the periods of April, May, and June. In those months, I received, $10.88, $11.01, and $6.07, respectively. My ads served in April and May averaged 150k, but in June, the numbers dropped, and I only had 70k ads served.

At the time of the drop, my site traffic had not decreased, which left me confused. What noticeably changed was that the CPM had dropped 75%. This may have resulted from increased site traffic from non-US sources, which don’t accrue the same degree of ad revenues.


In July and August, ads served dropped to 23k and 38k. However, my CPM increased from $0.09 in June to $0.27 in July and $0.36 in August.

This increase resulted in revenue of $6.54 in July and an improved $14.18 in August. This last amount was what pushed me over the $100 mark and triggered the payout I received.

My annual goal for the site is $74, which would cover the cost of the upgraded plan and custom domain name for 3 years. The domain was free for the first year.

That’s it for the third quarter report. I wrote more below, but I started reminiscing about sort of unrelated stuff.

In the past, when I would try to research hosting with other providers, I would ask for advice from people who had experience with other services.

I recall previously trying out Hostinger for a different website. I was on the free trial and had selected a basic plan.

Despite all the ads saying how low hosting was, they tried to pre-charge me $660 for a year of hosting before the trial had ended. I had to fight them on the charge before finally getting it removed and closing my account.

I tried a couple of others that were spoken highly of on Reddit, but I had similar experiences. All of this led me to decide that self-hosted sites with .org WordPress are actually more expensive than what WordPress.com offers.


I think the main difference between the platforms is the availability of Plugins on self-hosted sites. With a .com-hosted site, we don’t get plugin access without an upgraded plan, but .org sites get plugin access right out of the gate.

This revelation probably has soured some folks on the platform. I wonder, though, if self-hosted sites are too dependent on plugins? Would they be able to succeed without a crutch?

I see a similar trend with the introduction of AI to web design and other facets of online life.

People may start using it as a helpful aid, but soon enough, they become dependent on it for all of their activities. If the AI is offline or there is a bug, it cripples their ability to function.

It’s the same with plugins; when a bug appears or an exploit, the entire ecosystem is affected because everyone is dependent on these plugins.


Q1 Report for 2026

The information in this post is provided for informational purposes only and is not intended to be legal advice. While I have tried to ensure that the content is accurate and current, I make no guarantees. You should seek legal or other professional advice before acting or relying on any of the information.

My Wordads Experience (Q3-4)

Previous Article – My WordAds Experience (Q2)

Next Article – Quarterly WordAds Report for 2025


Last Updated: March 3rd, 2026

I got so busy with my eBay reselling that I forgot I had this series of posts I had said I would run. It is now partway through Q1 of 2025, so I have a little catching up.

Q3 – July, August, and September

Site traffic for these months was roughly the same as the previous period. But I did see an uptick in the number of ads displayed. I would attribute the increased ad views to the continued fine-tuning of ads on the more popular post topics.

As mentioned in the previous article, my goal is to reach $66 in annual earnings. This should cover the price I paid for the premium hosting plan featuring ad revenue.

MonthAds ServedAvg CPMRevenue
July22,531$0.23$5.11
August37,472$0.24$9.09
September30,110$0.20$6.05

I’m not entirely certain why the revenues shot up for August. The increased traffic was nice, but it seemed to peak and then fall off the next month.

I had removed some 20 redundant posts which may have caused the drop.

That “removal” had been in error due to a bad bot, and customer service was able to remove the error. They also clarified that the site was receiving traffic accurately.

After I got the green light, I relisted all the taken-down posts. This caused a surge in traffic to the “new” posts. Both the Google and Bing web crawlers showed an uptick in analytical data during this period. Many of those old posts had been removed from the indexes because they were old and didn’t get much traffic.

Q4 – October, November, and December

The holiday season was quite busy for me, which was a bit odd. As an atheist, I don’t celebrate anything and rarely go in for the irreligious events either.

Of course, if you shove a turkey my way, I’m not gonna pass off the food.

Anyway, I was busy with my eBay sales in the 4th quarter. I did some good sales volume and was able to finish the year at a break-even on my Excel balance sheet.

MonthAds ServedAvg CPMRevenue
October33,274$0.15$5.00
November33,556$0.20$6.87
December64,570$0.11$7.05

The site traffic seemed to hit a plateau in October and November, and I figured I had found my sweet spot between the wind and waves. I was a bit miffed at the lower CPM in Oct, as you can see it dropped to $0.15 and I lost $1.05 in revenue earnings compared with Sept.

November saw a return to better numbers despite no change in site traffic. I was starting to see a confluence of visitors on three posts in particular, though.

The Game of Vampires Wiki page I had created was getting some really good numbers and had been edging close to the top of my traffic list for several months.

I was still seeing steady traffic on the Game Guides for Puzzles and Chaos and some other high-value offers. I think it was around this time when some of the offers started going into the four-digit range and the Reddit folks were going nuts.

In December, I received around 7k more views than the previous months and 2,440 more visitors. The CPM went down drastically, but I did see an increase in my site revenue. I think many of the extra views were from repeat customers.

Top Traffic Sources

Sept’s top post was Puzzles and Chaos, for Oct it was the Game of Vampires Wiki, but come Nov, both were supplanted by the Top Girl Wiki. The game had gone through a couple of rebrands as the Alpha and Beta releases were cleared away.

I think writing a “Wiki” instead of a game guide made the difference.

Honestly, the Fandom-branded (Wikia) sites are all covered in terrible, unsafe advertisements. I can understand why someone would prefer to come to FWR instead.

There are many sites with guides, but few that claim to be a wiki, and that is what people are searching for when they look for guides. They type in “game wiki” or “game Reddit” to find info on whatever game they need help with.

The traffic to Top Girl Wiki tripled between November and December.

I also realized that the page I had thrown together was loading slowly on mobile devices and that the majority of my traffic was from cell phones. So, I added separate posts for a lot of the content, and I started using Pages instead of Posts.

This allowed me to set the wiki page as a Parent Page and the associated articles as Child Pages. The hierarchy makes for a more structured design format. Basically, it’s easier to navigate.

That will be all for this quarterly report on Wordads. I will try and remember to write another one in April 2025.